Data Visualization: Unlocking Your Data’s Full Potential
We live in a world of vast data, where effectively communicating information is vital. Data visualization has emerged as a powerful tool that can assist in presenting complex data in an easily understood manner.
Visualization of data allows individuals and businesses to gain valuable insights, leading to better decision-making. This guide explores all the nooks and crannies of data visualization, its benefits, and modern-day examples. We’ll also discuss diverse tools, software, and techniques you can use to visualize your complex data.

Data Visualization Examples and Applications
Data visualization can take many forms. It can range from simple bar or line charts to interactive dashboards and immersive virtual reality experiences. Regardless of the visualization method, it is vital to understand the presented data.
Many industries visualize data to help their audience gain valuable information and seek beneficial insights. Let’s highlight four data visualization examples that showcase their versatility and impact across various sectors:
- Health and Medicine
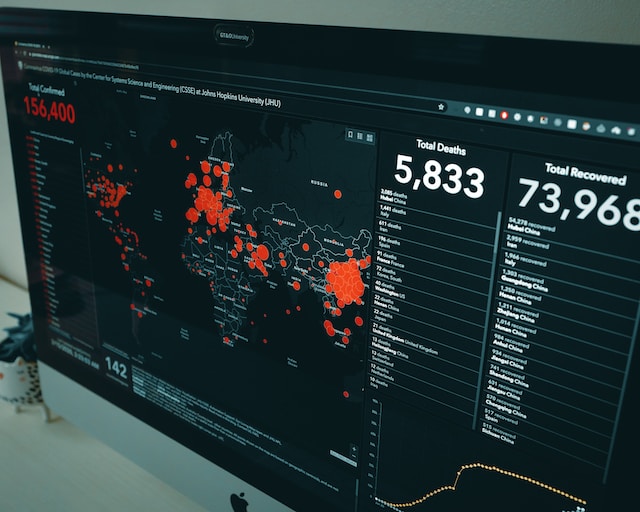
This sector visualizes data to aid diagnosis, track the spread of diseases, and monitor patients’ recovery. One excellent example is the use of interactive heat maps to display the spread of COVID-19 during the 2020 pandemic. This assisted public health officials in making informed decisions that positively impacted global citizens. Some of these include lockdown measures, quarantining, and social distancing to reduce the spread of the virus.
- Finance and Business
In the financial world, businesses use interactive dashboards, graphs, and charts to identify trends and patterns. This is prevalent in the stock exchange and Forex markets. Traders, investors, and stockholders can analyze financial data and make strategic decisions.
- Environmental Science
Meteorologists utilize visualization tools to display the temperature ranges of a particular region. As such, they can understand weather patterns and monitor ecological changes. They employ color schemes to differentiate between areas of colder temperatures to warmer temperatures.
- Journalism and Investigative Reporting
Visualization of data is crucial in presenting complex information to the general public. Many news channels utilize infographics and visual displays to enhance understanding of major news headlines. An example was the visualization of the 2020 US election, identifying states that voted for one political party against another.

3 Benefits of Data Visualization
Indeed, data visualization is important in almost every industry to convey information easily. We cannot underplay its significance in our daily lives as it helps us make sense of our data-driven world. Without further ado, let’s consider three benefits of data visualization.
- Improved Data Comprehension: When you visualize data, you simplify complex data. This makes it easier to notice patterns, trends, and relationships. Visualization has become a universal language that transcends borders. Visualizing data can effectively communicate complex ideas and insights to a diverse audience, fostering better understanding.
- Enhanced Decision-Making: Data visualization enables individuals and businesses to make data-driven decisions quickly. When they see a change in trend or pattern in data, it compels them to take quick action and make a positive impact.
- It Engages The Audience: Visualizing data engages the audience visually and mentally. It combines data with visual displays to captivate viewers, thus providing a deeper understanding of information.
Image: A user utilizes a data visualization tool on his PC to enhance his workflow.
Top Data Visualization Tools for Your Personal and Business Data Needs
Data visualization has numerous individual and corporate benefits. It improves data comprehension, promotes communication, and enhances decision-making. Consequently, being familiar with the data visualization tools that can help you achieve these results is important. Without further ado, here is a list of ten top visualization tools you can employ:
- Tableau
- Microsoft Power Bi
- D3.js
- Google Charts
- Chartblocks
- Infogram
- Plotly
- Qlikview
- RAWGraphs
- Datawrapper
These tools have unique features that communicate data effectively through compelling visuals. However, when selecting a visualization tool, it is vital to keep your audience in mind. Also, ensure your preferred tool is compatible with your data and offers further customization and flexibility.

8 Excellent Data Visualization Techniques
Aside from available visualization tools that provide compelling visuals, individuals and businesses can employ different data visualization techniques. Popular visualization tools incorporate these techniques, thus assisting you in getting the best visual insights for your complex data.
Furthermore, depending on your data type, you can employ basic or advanced visualization techniques. Some visualization techniques you can utilize for practical data analysis include:
- Bar Charts
- Pie Charts
- Scatter Plots
- Histograms
- Heat Maps
- Network Diagrams
- Tree Maps
- Line Charts
These visualization methods offer the needed versatility and flexibility to visualize your data. However, your choice of technique depends on the data type, the information you want to convey, and the target audience. Also, for your data visualization technique to be effective, ensure your data is accurate and unbiased to deliver impactful insights.

4 Popular and High-Paying Data Visualization Jobs
Visualization of data is a must-have skill to understand complex data in this modern day and age. Interestingly, you can monetize your visualization skills and earn your way to financial freedom. Notably, the average yearly salary for a data visualization specialist is approximately $97,000.
Therefore, you can become a vital asset to any industry by honing your visualization skills. Thus, here are the top-paying data visualization jobs and careers you can take advantage of as you improve your skills.
- H3: Data Visualization Engineer
Data visualization engineers are skilled professionals who design and develop visually appealing interactive dashboards using data from diverse sources. They are experts in data analysis and storytelling and proficient in business intelligence (BI) tools like Tableau or Looker. They create user-friendly dashboards for business teams, write and test analytics platform code, and troubleshoot any issues that may arise. Thus, these engineers play a crucial role in presenting data in an easily understandable format.
- H3: Data Analyst
Data analysts collect, clean, and interpret data to answer questions or solve organizational problems. They work across various industries, using data visualization skills to present information through graphs and charts.
Technical skills in Excel, R or Python programming, statistics, and SQL are essential for data analysts. They provide valuable insights to drive decision-making and business strategies.
- H3: Business Intelligence Analyst
Business intelligence analysts analyze and interpret data specific to businesses, such as sales revenue and market trends. They identify opportunities for growth and present their findings through reports to drive business profitability. Via data visualization, BI analysts contribute to data-driven decision-making within organizations.
- H3: Analytics Manager
Analytics managers lead teams of data analysts, overseeing analytics operations and translating data into actionable insights. They develop strategies, monitor performance, and communicate findings to stakeholders. As such, analytics managers are vital in driving data-driven initiatives and ensuring adequate data visualization.
4 Major Challenges of Data Visualization
Despite data visualization’s benefits and exciting careers, it isn’t without its challenges. Sometimes, these challenges negatively impact this important skill, rendering it incapable of unravelling complex insights. Here are some major challenges of data visualization in today’s data-driven world.
- Lack of Visualization Literacy
Knowledge of visualizing data can lead to clarity and accurate interpretations. Poorly structured visualizations can waste time and hinder decision-making. Common issues include using the wrong chart type, presenting misleading data, or creating visually cluttered graphs. Also, organizations’ lack of visualization literacy creates a barrier to becoming data-driven and impedes effective decision-making.
- Oversimplification of Data
While the visualization of data enables an easy understanding of presented data, oversimplifying it can pose a challenge. Oversimplification of data can leave out critical information, leading to incomplete or inaccurate decision-making. The audience may draw incorrect conclusions or miss the intended message without proper context. Thus, balancing simplicity and relevant context is crucial to ensure accurate understanding.
- The Inevitability of Heavy Reliance on Visualization
With the rise in demand for visualization tools, there is a risk of overemphasizing visuals. This can lead to an overreliance on visualizations without proper scrutiny, potentially leading to errors in development and decision-making processes.
- Human Error When Inputting Data
When visualizing data, it is vital to recognize that inputs and algorithms are susceptible to human error. Professionals may need to consider the nuances of each use case to pay attention to certain information or apply a one-size-fits-all approach. This can result in misrepresentation of ideas and insights.
Therefore, addressing these challenges is critical to harnessing the full potential of visualization and deriving meaningful insights from data.
Mapize: An Effective Data Visualization Software To Gain Valuable Insights
Visualizing data is a powerful skill that unlocks hidden insights within complex datasets. It enhances our understanding, facilitates data-driven decision-making, and allows us to communicate information effectively. From simple bar charts to advanced techniques, they have endless possibilities for presenting data compelling and meaningfully.
Interestingly, many data visualization software exists today that integrate essential and advanced techniques to provide valuable insights to users. However, among the numerous options available, Mapize stands out as an effective solution.
Mapize offers a user-friendly interface, extensive mapping capabilities, and intuitive design features. These features empower users to create visually stunning and interactive maps that showcase geospatial data effectively. This platform provides a seamless experience for all users, allowing them to explore and understand data in a spatial context.
Its advanced functionalities, such as customizable markers, layers, and interactive filters, enable users to craft engaging visuals that convey information. Mapize’s ability to integrate various data sources and handle large datasets makes it valuable for all business organizations.
By leveraging data visualization software like Mapize, you can unlock our data’s full potential. Join Mapize today and create your first custom map for free.