Generate Heat Maps: How To Go About It via Navigation Tools
In a world where data is an integral aspect of business, data presentation is often a key aspect of business operations. Interestingly, heat maps are one of the simplest and most effective means of summarizing and representing data.
In this post, we’ll discuss heat maps, how to use them, and how you can generate heat maps for your personal or corporate needs.
What Is a Heat Map in Business?
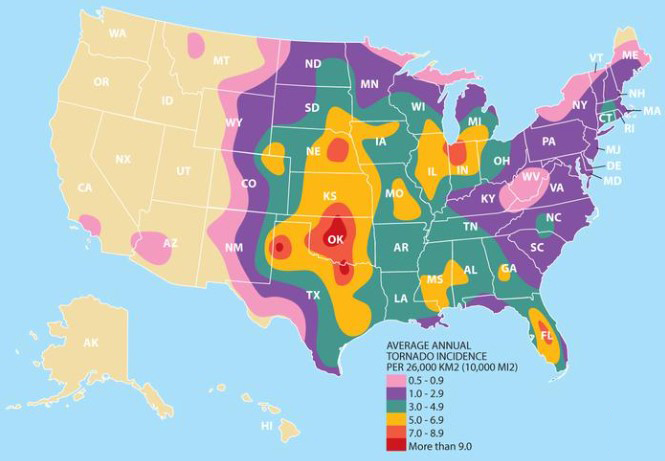
Owing to the rich nature of heat maps, people frequently ask, “What is a heat map in business?” A heat map is a type of visual data representation where colors represent values and other vital details. It can summarize and analyze different data types, including very large and complex data sets.
Business owners generate heat maps for simple data analysis, but special heat mapping tools can allow customizability for large and complex data. A wide array of professions and businesses utilize heat maps. Some of them include:
- Marketing professionals
- Product managers
- User experience designers
- Data scientists and many more
What Is Heat Mapping?
Now that you know what a heat map is, you may be curious to ask, “What is heat mapping?” It’s quite simple — heat mapping is generating heat maps.
How To Generate Heat Maps in Excel and Online
Although you can manually create a heat map in Excel by color-coding each cell yourself, it can be very tasking. Here are some methods to help you learn how to generate heat maps. Whether you are using Excel or creating them online using other resources, we have steps for you to follow. Keep reading our how-to’s to start heat mapping your own data sets.
4 Steps To Generate Heat Maps in Excel Using Conditional Formatting
Using conditional formatting, you can generate a heat map in Excel by highlighting the cells with colors based on preprogrammed values. Here are four steps for creating heat maps in Excel with conditional formatting:
Step 1: Select the data set that you want to highlight
Step 2: On the menu bar, click “Home”
Step 3: Go to conditional formatting
Step 4: Select “Color scales”
After this, you will see different color combinations that you can use to highlight your data. Other color combinations have different meanings, and you can preview the data set in a particular color combination by hovering your cursor over it.
Once you select your preferred color combination, excel automatically highlights the data set. Note that, by default, Excel highlights the data with gradients.
To manually remove the gradient:
- Click “Home”
- Go to “Conditional formatting”
- Select “Color scales”
- Go to “More options”
You will see a dialog box. Click the drop-down arrow under “formatting styles” and select “3-Color scale.” You can customize the minimum, maximum, and midpoint values, assign a color to them, and select “OK.”
Once you have finished, you will get a data set with only three colors according to your settings.

8 Steps To Generate Heat Map That Is Dynamic on Excel
When using the conditional formatting method, it is essential to note that the values in the data set can change. Once this happens, Excel automatically recalculates and highlights the values appropriately based on your previous settings. This means you can generate heat map that is dynamic in Excel. To do this, here are the 8 steps you should follow:
Step 1: Choose or create an Excel datasheet
Step 2: On the menu bar, click “Developer.”
Step 3: Click “Controls”
Step 4: Select “Insert”
Step 5: Click the scroll bar
Step 6: Right-click on the scroll bar and select “Format Control.” A dialog box will open where you can change your maximum and minimum values
Step 7: Paste this formula in the first cell: =INDEX(Sheet1!$B$1:$H$13,ROW(),Sheet1!$J$1+COLUMNS(Sheet2!$B$1:B1)-1)
Step 8: Resize the scroll bar and place it at the bottom of the data set
Alternatively, you can generate a heat map in Excel using radio buttons. This method allows you to highlight the top 10 or bottom ten values based on the setting for your radio button.
4 Steps To Generate Heat Map Online
As you’d expect, there are other heat mapping methods, such as generating heat maps online. Instead of using Excel, you can access one of many online mapping tools to help you generate it. To generate heat map online, follow these steps:
Step 1: Open any online heat mapping tool of your choice and choose a preferred heat map template
Step 2: Open your choice template, click “Edit,” and start customizing your heat map
Step 3: Open the spreadsheet editor to either import data from Google Sheets or input data manually
Step 4: Customize the data and edit colors and other properties as required

Generate Heat Map: Types of Heat Maps
Now that you know the different ways to generate heat maps, it’s time to take a closer look at the various kinds of heat maps available.
Different types of heat maps display data based on user behaviors, such as scrolls, clicks, and eye movement. Of course, this helps you understand how users interact with your website regarding page view duration and the content category they prefer. There are five major types of heat maps based on the data type they display, including the following.
The Eye-tracking Heat Map
An eye-tracking heat map analyzes data about visual focus. For instance, an eye-tracking heat map can analyze and summarize the view duration of certain elements on a website. This type of heat map analyzes users’ behavior and how they respond to certain features on the website.
Mouse-tracking Heat Map
A mouse-tracking heat map is a type of heat map that analyzes data based on mouse usage on your website. You can generate heat maps to display where users have clicked, hovered over, and scrolled on your website. A mouse-tracking heat map is also known as a hover map because it focuses on where visitors’ cursors hover over the most while on your website.
Click Maps
A click map is a type of website heat map that uses thermal imaging to display visitors’ activities on a website visually. The click map shows where the mouse cursor click-points are on the website.
This type of heat map is also known as a touch heat map, and you can generate heat maps for analyzing the engagements and activities of visitors on a website.
Scroll Maps
Scroll maps behave like click maps because they are used to track users’ engagement on a website. However, instead of analyzing where and what it clicks, scroll maps are more focused on monitoring the scrolling activity of the user.
A scroll map can indicate how far down the page a user scrolls and what part of the page the user spends more time on. When you generate heat maps like this, the hottest part (usually red) on a scroll map usually represents the part of the page visitors spend more time on.
Ai-generated Attention Heatmaps
An AI-generated heat map predicts the behavior of visitors on a website, such as what they look at first, what they spend more time on, and how they navigate the website.
It involves using artificial intelligence to generate heat maps that can use data from the eye-tracking heat map to predict users’ behavior. Therefore, another name for them is predictive eye-tracking heat maps.

When Should You Generate Heat Maps?
Heat maps are very useful for analyzing different types of data. Business owners looking to gain more insight into how customers use their websites will find it handy. Heat maps are highly effective for the following four reasons:
- Split Testing
You can also choose to generate a heat map for conversion rate optimization. Conversion rate optimization involves making changes and innovations to a website to improve engagement. You can test the effectiveness of these changes using the split test method. Heat maps like scroll and click maps are very important tools for such experiments. - Usability Testing
This is an experiment to get insight and data on how people use certain products and services. During this test, representative users get to use certain products while observers observe them to gain insight into how they use the products or services. Heat maps can help pinpoint areas of difficulty or where users get confused. - Website Analysis
After a new website design, heat maps like hover maps or eye-tracking heat maps help to analyze how attractive or engaging the new website design is to users. - Content Creation
One of the major purposes of creating content is to market products and services, and a good website should be engaging enough to get users to make the right clicks. You can generate heat maps like scroll maps to determine how much content users read and how far down the page they go.

Why Should You Generate Heat Maps for Your Website?
Heat maps are essential for businesses and websites for so many reasons. Creating them via web tools with high customizability features makes them even more versatile. Here are three reasons why you should generate a heat map for your website:

- Generate Heat Maps To Assess Your Website Performance
Heat maps help to highlight important areas concerning your website’s performance. For instance, it can draw attention to how many clicks your website gets, how engaging it is, and many more.
They can also make analysis easier. Of course, dealing with large numbers can be very daunting sometimes. However, heat maps represent numerical values with colors, making them easy to read and analyze. - Engage With Your Target Audience
Heat maps are an easy way to get to know your audience. When you generate heat maps, you can use the insights you derive from them to improve your products and services. By doing this, you’re invariably making your website more adaptable and engaging to your target audience. It allows you to access a wide data set and make necessary changes to suit your users’ demands. - Heat Maps Are Adaptable With Third-party Tools
Heat maps may not be a one-for-all tool for all your website analysis, but you can easily integrate them with other analytical tools to give you more informed and optimized results. For instance, you can use heat maps with Google Analytics. With it, you can gain even more insights into what your audience is doing on your website and how they’re doing it.
Mapize: The Ultimate Tool To Help Users Generate Heat Maps
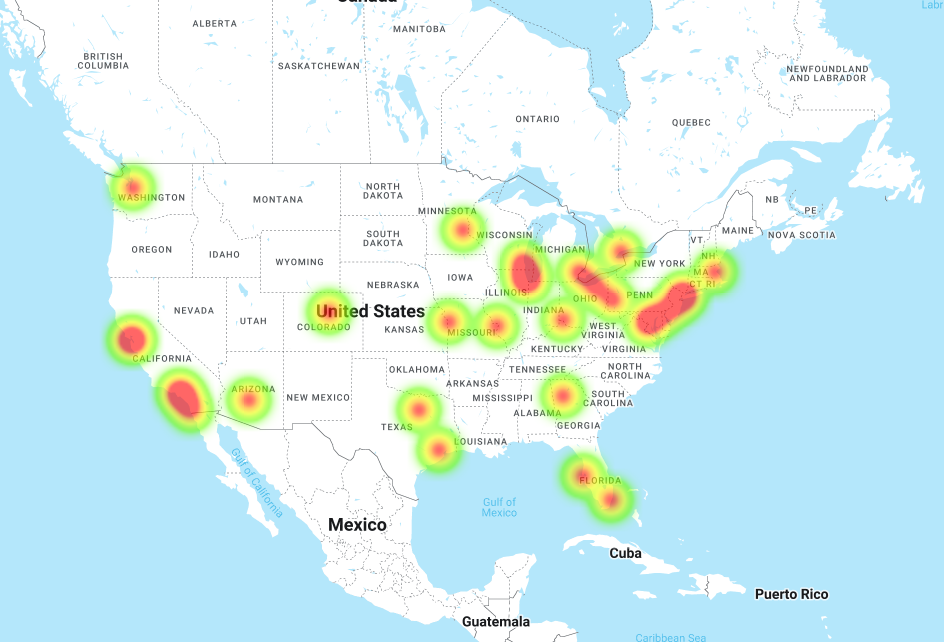
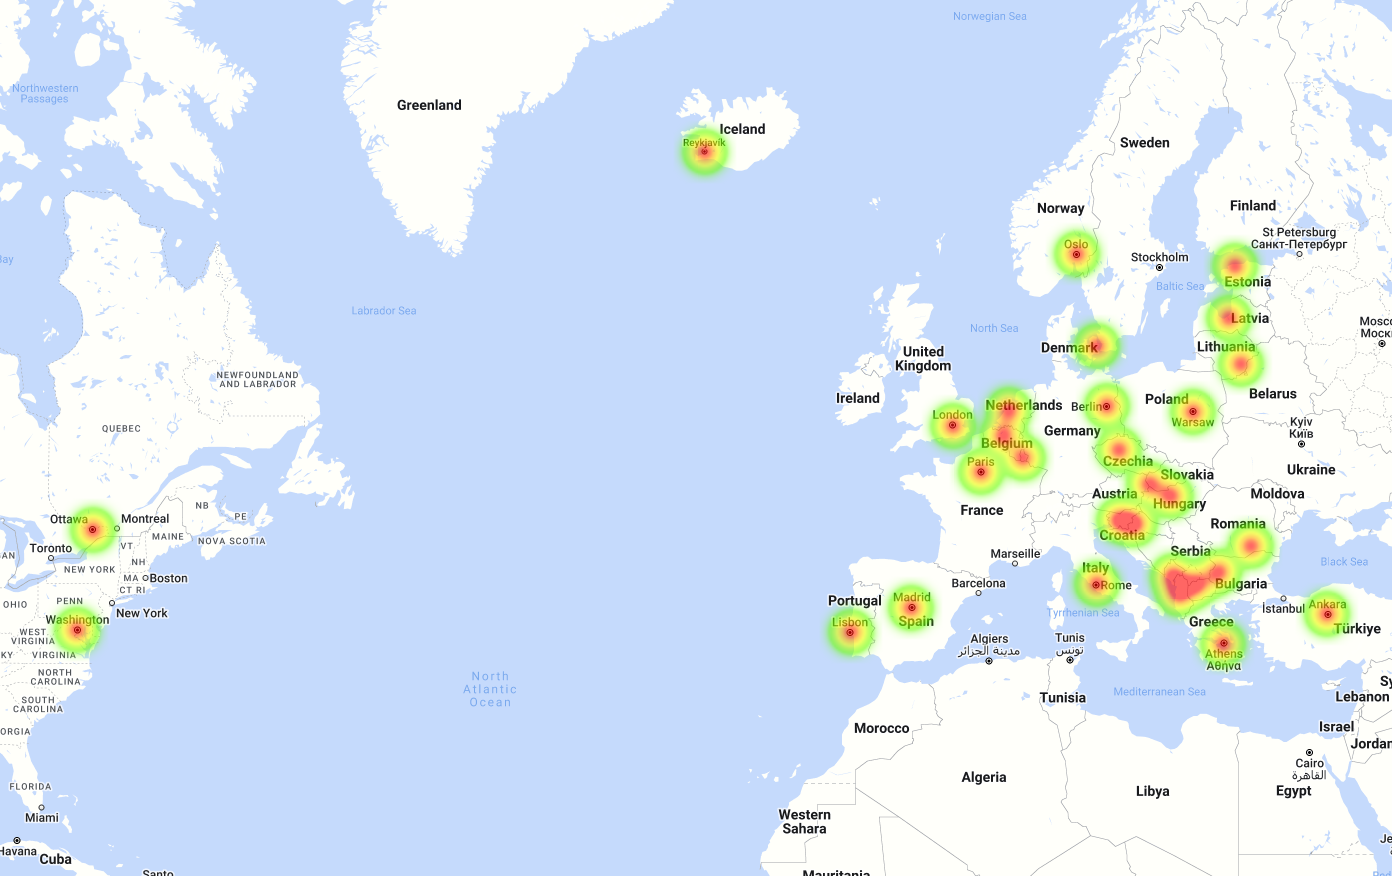
Mapize is an innovative and interactive software for creating highly customizable maps. It has a user-friendly interface that makes it very easy-to-use, for users seeking ways to generate heat maps. Some of Mapize’s capabilities include the following:
- Building and customizing heat maps
- Exporting and sharing maps
- Analyzing driving distances from one destination to another
- Grouping and filtering data
- Include store locators
- Direction optimization to help customers locate you faster and easier
View Test Map in a full screen map
Closing Thoughts on How To Generate Heat Maps
Heat maps are highly useful tools with multiple use cases, helping users generate deep website insight and understand their online audience. Although you can generate heat maps via Microsoft Excel, the process is lengthy, and customizability options are severely limited.
This is where Mapize comes in, as its intuitive interface can help users generate dynamic heat maps quickly. More so, Google Enterprise-level Mapping technology also powers Mapize. This innovation gives users access to global coverage and high-performance mapping tools. Are you ready to take a bold step to optimize your business website? Try us out for free and create your first map!