Heat Maps: A Complete Guide
Data representation is a unique aspect of human activities. Without it, we cannot ascertain the world’s population or the traffic our business websites generate. As we daily engage in digital services, several data collections require proper and visual representation so people can easily interpret them.
The development of heat maps allowed people to represent data sets through colors. This visual feature has assisted many business owners in utilizing them as an effective tool to market their products and services to users.
This guide provides a well-detailed discussion of how to create and read heat maps. Ultimately, you will learn how to implement them to help you succeed in your business.
What Is a Heat Map?
Have you ever seen a news report showing the maps of certain regions? Sometimes, these maps will depict different colors which represent specific information. If you nodded yes to this question, what you saw were heat maps. Many often wonder, “what is a heat map?” and hope to get a clear answer online or in journals. Well, it’s quite straightforward.
A heat map is a visual representation of data on a map using colors to convey its values and meanings. It also displays the distribution of data in a geographic region in time. It comes in different shapes and color schemes. The color schemes may vary in intensity to depict the degrees of certain data.
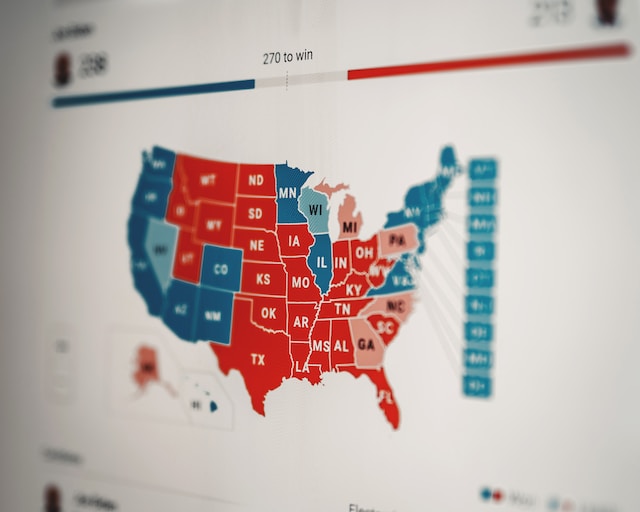
They provide a visual summary of data without needing actual numbers. How so? Consider the 2020 United States presidential election. Citizens might not be interested in the number of voters in each state. Instead, they’d prefer a visual summary of the states a presidential candidate has won. Using a heat map became a visual tool for providing quick information about the electoral process, thus presenting the data in red and blue.

Heat Maps: 4 Main Types
Besides its use in electoral processes, heat maps are helpful in many industries, including marketing, finance, health care, and academia. Since they focus on important information, users can understand visual representations and use them for various applications.
Consequently, it is essential to discuss the four main types and consider how individuals and businesses use them for beneficial purposes.
Click Heat Maps
They are the most common type of heat maps that various modern business organizations use. Essentially, they record data based on how visitors click the landing page of your website. They reveal how users interact with your website’s homepage and what sections they click to access more information.
Using click heat maps helps business owners streamline their websites in a user-friendly manner, thereby helping them record more clicks per user and generate more traffic.
Scroll Maps
As its name implies, scroll maps monitor and record users’ scrolling behavior. It can accurately determine where users scroll on your page and helps you achieve an optimum user experience.
These types of heat maps are helpful to either shorten or increase the length of sales pages on your websites. Suppose a user gets midway through your webpage. In that case, you could adjust by making your product description shorter and vice versa.
Hover Maps
Hover maps are also called mouse-tracking heat maps, and their goal is to track users’ mouse movement on your website when using their PCs. However, many question the reliability of hover maps, as users might hover their pointers in a direction, but their focus isn’t there. Also, they are practical in providing users’ behavior on a website based on their mouse movement.
Eye-tracking Heat Maps
These heat maps record users’ eye movements on a website page. When using this map type, users wear special tracking devices in labs. These devices measure eye movements accurately.
In recent times, eye tracking has evolved into the use of webcams. With this feature, marketers and business owners can strategically place their products and ads in users’ natural eye path to help increase engagement and sales conversion.
4 Steps on How To Create Heat Maps
Heat maps are an excellent tool for representing data in colors so users can interpret them quickly. Perhaps you’re wondering if you can create a heat map for your personal or business use. The answer is yes!
Creating a heat map depends on the data you are trying to represent and the mapping software you use. Here are the four steps to follow:
Step 1: Select Your Preferred Data for the Heat Maps
Select the data you want to represent in a map. It is beneficial to use a heat map if you are trying to implement a large data set. Some common data sets include population data, website traffic, weather patterns, consumer buying behavior, and others.
Step 2: Select a Correct Heat Mapping Software
Now that you know the data you want to implement on a heat map, you must choose your preferred heat mapping software to create your maps. This software provides a two-dimensional representation of how customers interact with your business page.
They visualize user actions in real-time when users access your website via clicking, scrolling, or mouse hovering. Effective software includes features that will make your business grow and attract more customers:
- Behavioral Analysis: It helps change your website to improve your user experience.
- Predictive Analysis: This tool helps to analyze and predict outcomes based on past data on the website. It can help identify risks and investment returns to increase your website’s productivity.
- Real-time Monitoring: This tracks how visitors engage your website in real time and adjusts to new trends.
- Use of Surveys: This feature helps users or visitors vote on features they like or dislike on your website.
Thankfully, there is a lot of software you can employ when creating your heatmap. Some include Content square, Mapize, Crazy Egg, Hotjar, FullStory, and Inspectlet. When selecting your software, ensure your data format is compatible with your preferred heat mapping software. It can be in a CSV file, spreadsheet, or other available formats.
Step 3: Choose the Color Schemes
The next step in creating your heat maps is using the correct color scheme. As mentioned in this guide, color can showcase the data’s intensity, ranging from cool colors (like green or blue) to warm colors (orange or red).
Step 4: Make Your Heat Maps
Heat maps are easy to create if you follow the previous steps strictly. So, use the correct software, provide the necessary data, and utilize a good color scheme or any other customization you choose.
How To Read a Heat Map
Interesting read so far! You now understand the concept of heat maps. Also, you have learned how to create one. Now let’s discuss how to read them. Of course, reading them is not a walk in the park. It requires enough practice, patience, and understanding. Here are simple tips on how to read a heat map effectively.
- Pay Attention to the Color Scheme
It is vital to take note of the color schemes when reading a heat map. While they vary based on individual preference and data given, specific colors strongly indicate certain data sets. Cooler colors often represent data of low values, and warm colors represent high-value data.
- Spot Identifiable Trends on the Map
Another tip is to identify trends in the data represented. It may be challenging to spot them when this data is on a spreadsheet. So, you can observe specific trends when you define data as a heat map.
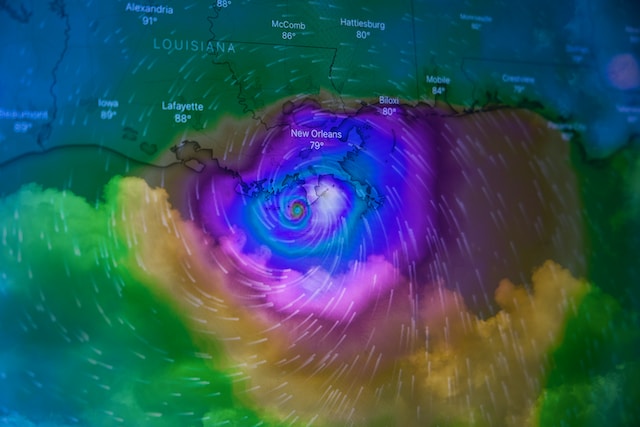
For instance, a weather heat map features weather patterns from thousands of locations in a geographic region. In this form, you can easily access how adverse the weather is across the region.
- Compare Your Map With Trusted Sources
While it is true that heat maps are powerful visualization tools, you shouldn’t use them independently. So, checking other sources of information like journals, spreadsheets, and other visual tools helps ensure your observations on your map are accurate.
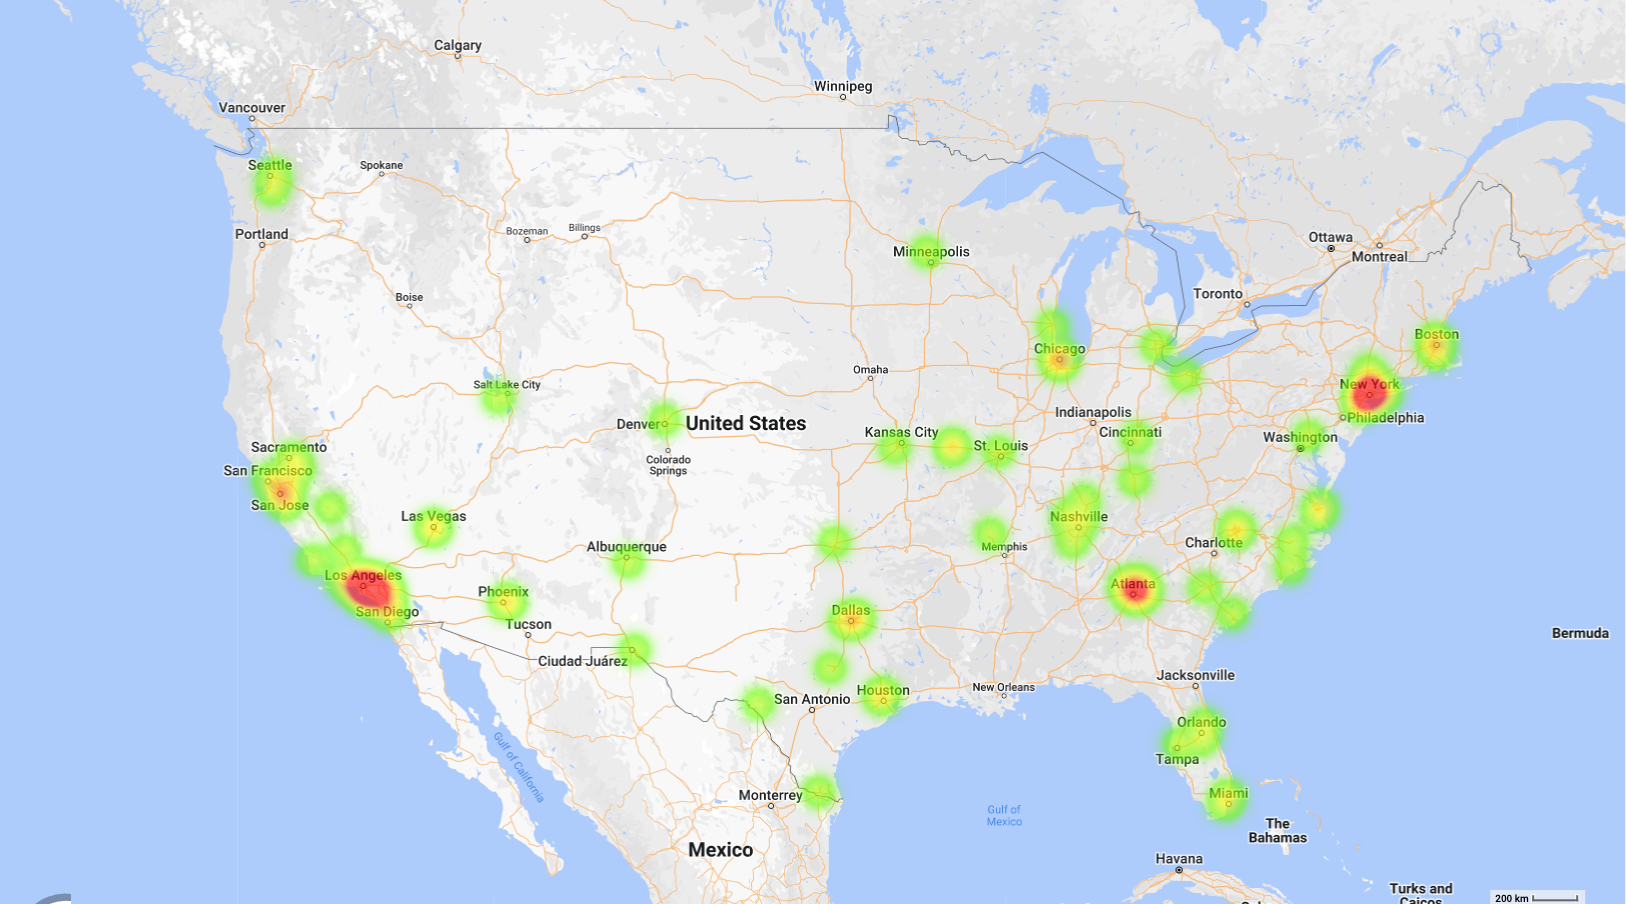
View Test Map in a full screen map
Final Thoughts: Mapize Is the Right Place To Create Heat Maps
Indeed, you now have a deeper understanding of what heat maps are, their types, and how to create and read them. Heat maps are excellent visualization tools. You can utilize their potential when you understand their color schemes and patterns and compare them with relevant data sources.
Suppose you are searching for a mapping platform that can generate heat mapping features and other customization options. It would be best to consider Mapize. Mapize is an innovative mapping platform that provides a simple way to create custom maps.
You can utilize this mapping platform for your personal and business use. Also, Mapize integrates data sources from Google Maps, thus allowing you to customize your mapping experience. Get involved with Mapize and create your first map today.