Population Density Maps: Understanding Distribution Patterns
In our ever-changing world, one thing remains constant – the continuous growth of the human population. As the earth becomes populated, it becomes crucial to understand the distribution of people across different regions. This is where population density maps come into play.
By closely examining them, we can explore the intricacies of human habitation. It captures the concentration and dispersion of human settlement and reveals the hotspots of activity and the pockets of tranquility.
In this guide, we’ll explore the concept of population density maps and their significance. Also, we’ll look at the population maps of the United States and Canada and consider their population distribution patterns.

What Is a Population Density Map?
From densely populated cities to sparsely populated rural areas, humans have managed to occupy diverse regions across the globe. Thus, population density maps give us a unique perspective on human distribution, revealing historical, cultural, and geographic patterns.
So you are right to ask, “What is a population density map?” It is a visual representation that illustrates the distribution of humans across a specific geographic area. It provides valuable insights into the concentration or dispersion of human populations. It also comprehensively explains the density patterns within a region or county.
This map falls under the choropleth map type. It helps us visualize areas of high and low population concentrations through colors or shading techniques. This further aids the analysis of settlement patterns and the identification of demographic and urbanization trends. To know how this map works, we must calculate the population density of a particular area.
Typically, you can calculate population density by dividing a specific area’s total population by its land area.
Mathematically, population density = Total Population Land Area
The result represents the average number of individuals per square kilometer or miles (depending on your intended SI unit).
On the population density maps, colors represent the intensity of population concentration in a given area. Darker or more vibrant colors indicate areas with high population density. In contrast, lighter or more muted colors represent areas with lower population density.
Applications of Population Density Maps in Today’s Modern World
Employing a population density map offers numerous benefits and applications across different fields. Here are a few benefits and applications that make this map valuable in our modern world.
- Understanding Human Settlement
Population density maps provide insights into the distribution of people across various regions, helping us comprehend human settlement patterns. They unveil the dynamics of urbanization, rural populations, and the overall geographic distribution of communities. By visually representing the distribution of populations, they aid the analysis of the social, economic, and environmental implications of human settlement.
- Informing Policy and Planning
These maps are crucial for policymakers, urban planners, and researchers. They assist in making informed decisions related to infrastructure development, resource allocation, and service provision.
Policymakers can plan to distribute resources and services efficiently by identifying areas of high population density. These include healthcare facilities, transportation networks, and educational institutions. These maps help optimize urban planning strategies and contribute to sustainable development.
- Demographic Analysis
Population maps enable researchers to conduct detailed demographic analyses. Researchers can identify trends that inform socioeconomic studies by examining the population distribution across age groups or socioeconomic backgrounds.
These maps also facilitate studying population growth, migration patterns, and spatial disparities. Ultimately, this provides valuable insights for social scientists, economists, and demographers.
- Environmental Impact Assessment
These maps are instrumental in understanding the environmental impact of human populations. By overlaying population density with environmental data, researchers can assess and identify areas at risk of ecological degradation. This information aids in the development of sustainable environmental policies and conservation strategies.

Understanding the Population Density Maps of the United States and Canada
Population density maps offer a captivating view of our world’s diverse human landscapes. It unveils a global patchwork of densely populated areas and vast expanses with sparse populations. Interestingly, the United States and Canada, two neighboring countries in North America, boast vast landscapes and diverse people.
Analyzing their population density map provides valuable insights into the distribution of people across these nations. Let’s explore the population maps of the US and Canada to understand the dynamics of human settlement in each country.
Exploring the US Population Density Map
The map of the United States with states and cities is a focal point in understanding how its population density map works. The United States comprises 50 states and a capital city, divided into several distinct regions. These regions include the Northeast, Southeast, Midwest, Southwest, West, Rocky Mountain states, Alaska, and Hawaii.
The US population density map reveals a complex tapestry of settlement patterns. Concentrated population centers are evident along the East Coast, from Boston to Washington, DC. Similar patterns are evident along the West Coast, from Seattle to San Diego.
Remarkably, the megacity of New York City stands out as one of the most densely populated areas in the country. It is home to millions of residents living in a relatively small space. As we move inland, the population density gradually decreases, with the Midwest featuring a mix of cities, suburban areas, and rural regions. Major urban centers like Chicago, Detroit, and Minneapolis anchor the population in this region.
The Southwest, including cities like Phoenix, Las Vegas, and Los Angeles, exhibits high population densities influenced by favorable climates and economic opportunities. Furthermore, the map showcases the vast expanses of sparsely populated areas in the United States.
A lower population density is characteristic of the Rocky Mountains, the Great Plains, and the deserts of the Southwest. Remote regions such as Alaska, with its harsh climate and rugged terrain, have some of the lowest population densities in the country.
Exploring Canada Population Density Map
The Canada population density map highlights a striking contrast with its southern neighbor. While the United States features densely populated urban areas around several regions, Canada’s population is concentrated mainly along the southern border. Most Canadians live within 100 kilometers of the Canada-United States border due to factors like milder climates, economic opportunities, and transportation corridors.
Cities such as Toronto, Montreal, Vancouver, and Calgary serve as Canada’s focal points of population density. These urban centers are economic powerhouses, attracting people from across the country and worldwide. They offer various employment opportunities, cultural amenities, and quality-of-life advantages.
As one moves away from the southern border, population density rapidly declines in Canada. Vast stretches of wilderness dominate the northern regions, including the Canadian Shield, the Arctic tundra, and boreal forests. These remote areas have very low population densities due to their harsh climates, challenging living conditions, and limited infrastructure.
Additionally, Canada’s population density map reveals the country’s unique demographic distribution. Indigenous communities in the northern and remote regions contribute to the cultural diversity of Canada. Their settlement patterns often align with historical and traditional ties to the land, access to natural resources, and traditional livelihoods.
Methodologies of Creating Population Density Maps
Creating an accurate population density map requires a combination of sophisticated methodologies and reliable data sources. Demographers, geographers, and statisticians utilize various techniques to estimate population distribution.
One common approach they use is census data. It provides detailed information about population counts at specific geographical units, such as cities or administrative boundaries.
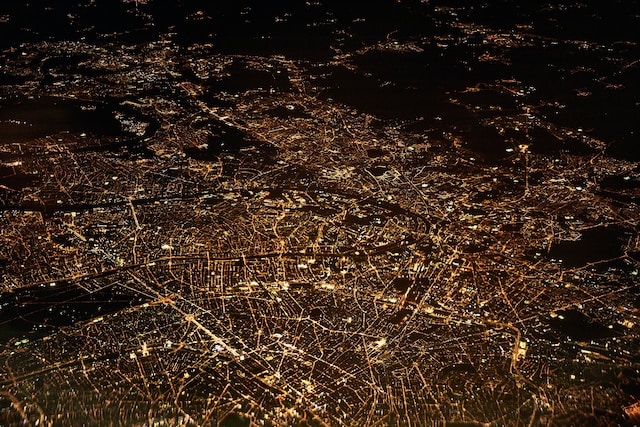
Another method involves using remote sensing and satellite imagery. They can provide valuable insights into the density of settlements by analyzing light emissions at night. This technique, aka “nighttime lights,” is essential for estimating population density in areas where census data is limited or outdated.
As technology advances and data availability improves, population density maps become increasingly sophisticated. High-resolution satellite imagery, advanced modeling techniques, and real-time data collection offer new possibilities for mapping population density.
These advancements will allow us to monitor population dynamics more effectively and respond to emerging migration and climate change challenges.
Mapize – An Excellent Platform For Developing Interactive Maps
Mapize is a powerful mapping platform that can significantly aid in creating and analyzing population density maps. With its innovative features and user-friendly interface, Mapize offers several ways to enhance visualizing and understanding of population density patterns. Here are three ways Mapize can help:
- Data Visualization
Mapize allows users to upload and visualize population data in a spatial context. Users can create compelling visualizations that showcase population distribution patterns by overlaying population counts or densities onto visually pleasing maps. The ability to customize colors, symbols, and labels helps convey the information effectively. This makes it easier to interpret and communicate population density insights.
- Interactive Exploration
Mapize offers interactive features enabling users to explore maps dynamically. Users can zoom in and out, pan across different regions, and toggle between different layers of information. This interactive functionality enhances the user experience and allows a deeper understanding of population density variations across specific areas.
- Collaboration and Sharing
Mapize facilitates collaboration and sharing of maps. Users can easily collaborate with team members or stakeholders by granting them access to specific maps or projects. This collaborative environment promotes knowledge sharing, encourages data-driven decision-making, and allows for a collective understanding of population density dynamics.
Mapize offers features that enhance the creation and interpretation of population density maps. By signing up with Mapize, you can gain deeper insights into population distribution patterns, uncover trends, and make informed decisions. Join Mapize Today and create your first population density map for free.