What is a thematic map is a common question among those starting in data visualization. It’s vital to choose proper mapping techniques to represent your data. Why? These techniques influence whether your audience will correctly interpret the information you showcase via maps.
Understanding what thematic maps are and knowing when to use them is essential for data visualization. This article covers this topic comprehensively so that you can create high-quality maps that tell a story.
What Is a Thematic Map?
A thematic map is a way of showing the relation between data and geographic locations. As the name suggests, these maps correspond to a theme. Generally, the theme depends on the data you want to represent on the map. For example, it can be population density, income distribution, climate zones, pollution levels, and literacy rates, to name a few.
Why do cartographers use these types of maps?
- One common reason is to show the audience detailed information about a specific geographic location. For example, the income distribution of an area will help people identify regions of wealth and poverty.
- Another situation that warrants its use is comparing differences or patterns between maps. For instance, change in voting patterns during multiple presidential elections.
In short, these maps will highlight a region’s economic, social, political, and physical attributes.
Although it is common for cartographers to use these charts, they aren’t the only ones. They are popular among businesses as it helps them make decisions vital to their success. An example is a company using these charts to identify the next location to open a physical store.
Governments also rely on this map as it helps with resource management and infrastructure planning. Environmental agencies can map out wildlife habitats and other natural resources to monitor and protect these regions.
What Are the Different Types of Thematic Maps?
Different types of thematic maps exist, depending on what you want to use them for. Some work well when you have general data about a region, while others excel with distinct data sets. Below are six common types of thematic mapping techniques you can use to visualize your information:
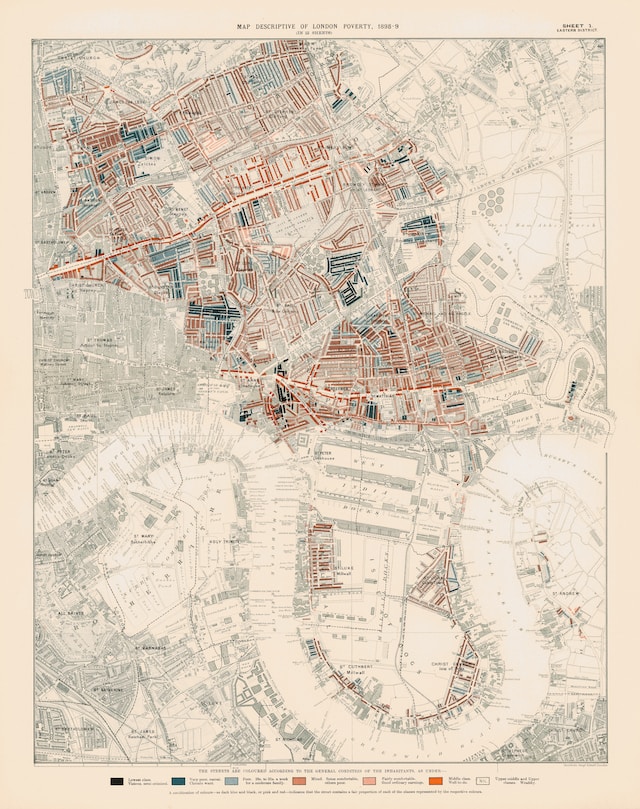
1. Choropleth Map
A choropleth map uses colors to visualize your geographical data sets in specified regions. It is a common variant of this special-purpose map that helps you identify patterns with colors. You group your data sets into various classes and assign them different hues as identifiers.
Advantages
- People use these charts because any audience will find it easy to read them, regardless of their expertise.
- Due to its visual appeal, it is easy to compare different regions and recognize patterns.
- You can also use other popular mapping techniques to make sense of your data.
Disadvantages
- Although you don’t need much time and effort to create these charts, you shouldn’t use them for everything. If you have specific data, you won’t get the best results with this chart.
- Similarly, you must consider how you arrange your data into classes. Small mistakes can result in significant inaccuracies during data visualization. Also, if the area of interest is small, it becomes harder to map the data.
Use Case Examples
- This visualization technique excels when you want to highlight a region’s population density.
- It is an excellent way to represent sales revenue for multiple stores.
- Also, you can map out the demographics for different areas, like education levels and average household income.
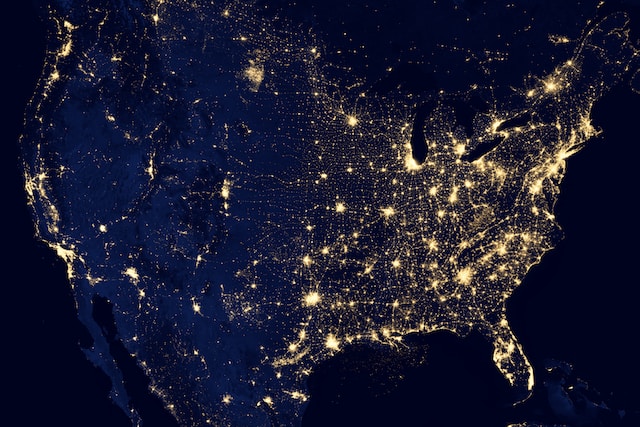
2. Heat Maps
Cartographers use heat maps to represent the intensity or density of your data sets with colors. Hues help differentiate between these maps’ low and high ranges of values. This makes it easy to identify opportunities that won’t be as obvious if you only look at the raw data.
This one also uses colors, so people tend to mistake it for a choropleth map. However, a heat map is different as it doesn’t have to follow geographic boundaries like postal codes, states, or countries.
Advantages
- The primary reason why this is a common map is that anyone can interpret the data. Legend colors make it easy to understand what the chart conveys.
- It makes pattern recognition easy and quick, making data set analysis straightforward.
Disadvantages
- It is harder to differentiate between your data sets if the variance is low. This is due to the use of colors to represent your data.
- You can only use this map type with all the necessary data. Incomplete or missing information will result in significant inaccuracies.
Use Case Examples
- You want to analyze the performance of your marketing and sales departments.
- You’re looking to identify regions that don’t receive adequate service.
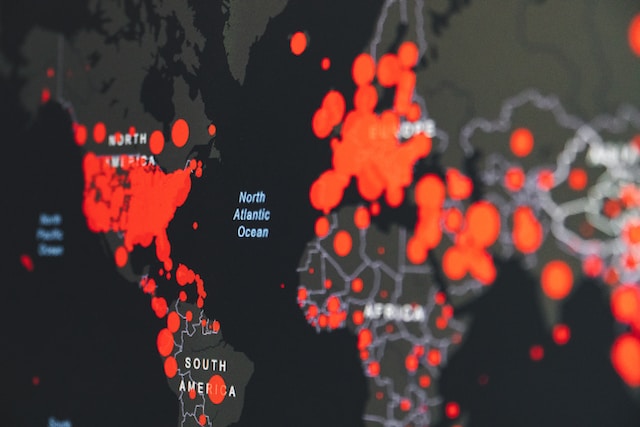
3. Dot Density Map
As the name suggests, a dot density map uses dots to describe the density of your data points. The value of each dot depends on the cartographer’s preferences. One-to-one dots means a single dot represents one data set. On the other hand, one-to-many relies on the discretion of the cartographer.
The rule of thumb when representing multiple values is to use a map legend. This prevents confusion while ensuring people interpret your chart correctly.
Advantages
- This makes it easy to show variations in your data sets.
- It allows you to use exact values with pinpoint precision and accuracy.
- It offers excellent accessibility, especially for people with color vision deficiencies.
Disadvantages
- When there are areas with no dots, people may assume these regions have no values. This may not always be the case.
- It is harder to interpret your data accurately if the dot density is high in certain areas.
- If you use too many dots, it can hide geographic features.
Use Case Examples
- Tracking the spread of diseases across different regions.
- Measuring the density of resources like mineral deposits in specific areas.
- Highlighting the concentration of your customers in multiple regions for market research.
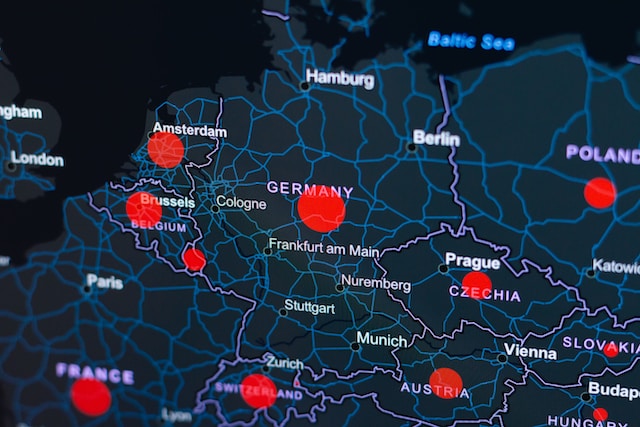
4. Graduated Symbol Maps
In these map variations, you use symbols in place of your data sets. However, the size of the shapes is proportional to the value. If you want to represent large values from your data, you increase the size of the symbols.
Cartographers tend to use circles as it is an easy way to show the size of the data set. Also, people find it easier to differentiate the size difference between circles when compared to other shapes. You must add your data to different classes to make this map effective. If you use more categories, you must increase the number of symbols.
Advantages
- When you need to showcase the differences between multiple regions, this type of chart makes it easy.
- You can quickly interpret large amounts of data.
- It reduces clutter without any loss in clarity of your data quality.
Disadvantages
- Large shapes make it harder to grasp geographical locations.
- If you don’t use the correct symbol, it becomes harder for your audience to understand the differences in magnitudes.
Use Cases
- Show the availability of healthcare services, like the number of beds in a hospital.
- The magnitude of earthquakes, hurricanes, and other natural disasters in different regions during a certain period.
5. Isarithmic Maps
Isarithmic maps portray continuous data points like the differences in elevation in various geographic regions. These charts use contour lines to depict data sets with the same value. However, some isarithmic maps, like the ones showing temperature and pressure, will combine colors and contour lines.
For example, you’re looking at a mountain range on a map. Rather than using lines of different heights, you use lines at the same level. If there are several lines close to one another, it indicates you’re looking at a higher elevation. Similarly, the further apart the lines, the lower the height.
So, if you were to look at one mountain, the contour lines would be further away at the base. As you get closer to the peak, the space between the lines reduces.
Advantages
- It is easy to read if your audience has the necessary technical knowledge. As a result, people will be able to understand the change in values.
Disadvantages
- Non-technical people may not understand what you’re trying to show with an isarithmic map.
- It is harder to create one if you don’t have a suitable dataset.
Use Cases
- Show climate, elevation, weather, and precipitation patterns in different regions.
6. Flow Map
The flow map is the last type of special-purpose map you must know about. It is a data visualization technique to show the movement of various subjects, like goods, animals, people, money, and traffic.
As you use lines to represent movement, the thickness corresponds to higher values. There are several types of flow maps:
- Radial Flow
- Distributive Flow
- Network Flow
Advantages
- It is easy to interpret regardless of the viewer’s expertise in cartography.
- You can show large patterns across multiple areas.
Disadvantages
- The legend is crucial in how easy or difficult it is to interpret the flow map.
Use Cases
- Tracking the migration of people across different countries and continents.
- Movement of goods across multiple regions.
- Flight paths of various airlines worldwide.
What Is a Reference Map?
When learning about these special-purpose maps, you’ll come across this term – reference map. What is this type of chart? Well, think of it as a foundational map that gives you all the information you need about a location. It will show you all the region’s features, such as country names and boundaries of the area. But it doesn’t stop there; you can also see natural features like lakes, rivers, mountains, and deserts. A chart showing your city’s subway lines is an example of a reference map.
What is the relation between this chart and a thematic map? Cartographers use the reference chart as the base for their thematic map.
Without this type of chart, knowing what you’re looking at becomes hard. In other words, it provides context to your map.
Mapize Is a Powerful and Easy-To-Use Thematic Map Creator
You now know how to create thematic maps and use them to tell your story with data. Remember to use the right chart, as it can significantly affect how your audience interprets the information. You also have to consider other factors to make your maps effective. For instance, what is the use case for your chart? Who is your audience, and how do you ensure they’ll understand your visual depictions? Are you looking for a thematic map creator with all the features to make high-quality maps? Your search ends today with Mapize.
When you have loads of geospatial data, you want to ensure you visualize them accurately. Mapize is an online map creator that can transform geographical data into visually appealing charts.
With this tool, you can make any of the above types of special-purpose maps. It doesn’t matter if you don’t know how to code, as this tool will do all the handiwork for you. You can place thousands of markers in your charts and control what your audience can see at any zoom level. In other words, you can change the level of detail to ensure your custom maps run on any device.
Change the color schemes per your requirements and discover new patterns and geospatial relationships with Mapize. Use the guides on what is a thematic map to know what to do with your geospatial data.
Try Mapize for free today to unlock the true power of your datasets!